
search the site


Infographics: Key figures of total shipping losses 2009-2018
Infographics: Key figures of total shipping losses 2009-2018 – SAFETY4SEA
In its annual Safety and Shipping Review released this week, Allianz provided a statistics review of shipping incidents by year, by vessel type, by cause and by region, for the last decade (2009-2018). The report revealed that the number of total shipping losses have fallen significantly to 46, representing the lowest total this century.
Casualties | 05/06/19
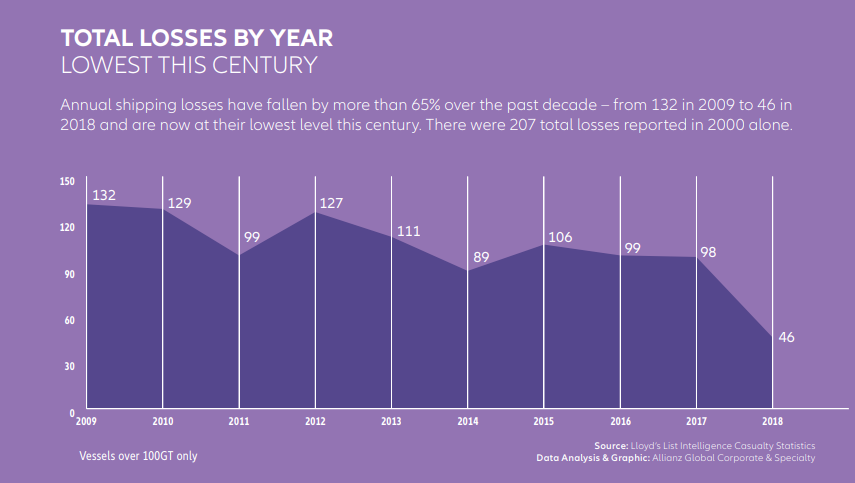
Annual shipping losses have fallen by more than 65% over the past decade – from 132 in 2009 to 46 in 2018 and are now at their lowest level this century. There were 207 total losses reported in 2000 alone.
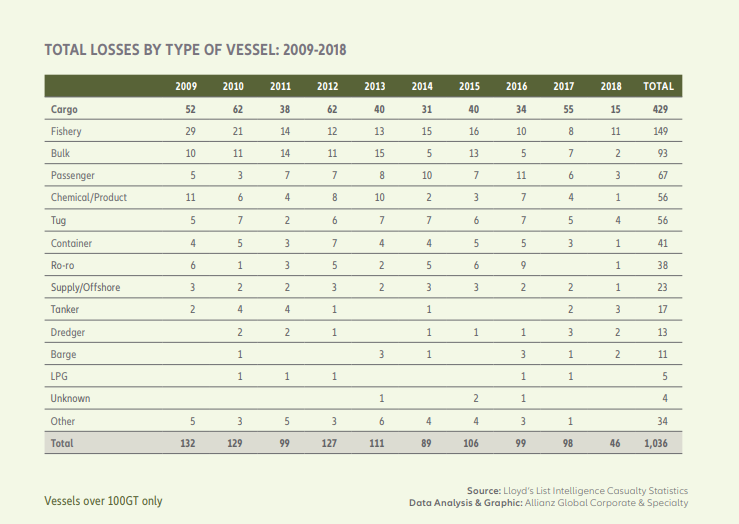
Total losses by type of vessel

- Cargo vessels accounted for over 40% of total losses over the past decade.
- Following cargo, fishing, bulk, passenger and chemical/ product are the vessel types that have seen the most total losses over the past decade. They all together account for 75%+ of all cases.
- However, loss activity involving cargo vessels was significantly down year-on-year – by over 70%.
- Fishing vessel loss activity increased year-on-year with 11 total losses reported.
- Passenger ship total loss activity declined year-on-year.

Total losses by cause
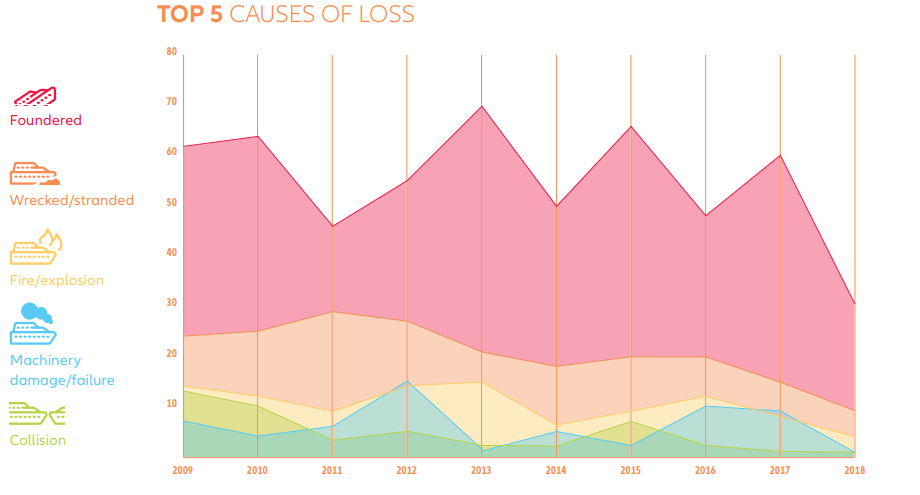
- Foundered (sunk/submerged), wrecked/stranded, fire/ explosion, machinery damage and collision are the most frequent causes of total losses over the past decade, accounting for over 90% of all reported cases.
- Of the 26,022 reported incidents over the past decade, more than a third (8,862) was caused by machinery damage or failure – over twice as many as the next highest cause of incident, collision (3,648).
- The number of machinery damage incidents have increased by a third over the past decade.
- Foundered (sunk/submerged) has been the cause of over half of all total losses (53%) over the past decade. In 2018 it was the primary cause of more than 65% of losses around the world.
- Machinery damage/failure was the top cause of incidents in 2018 (1,079) accounting for 40%.
- Fire and explosion activity increased during 2018 with 174 reported incidents.
- Analysis of more than 230,000 marine insurance industry claims with a value of €8.8bn ($9.9bn) between July 2013 and July 2018 by AGCS shows that ship sinking/collision incidents are the most expensive cause of loss for insurers, accounting for 16% of the value of all claims – equivalent to €1.39bn/$1.56bn.

Total losses by region
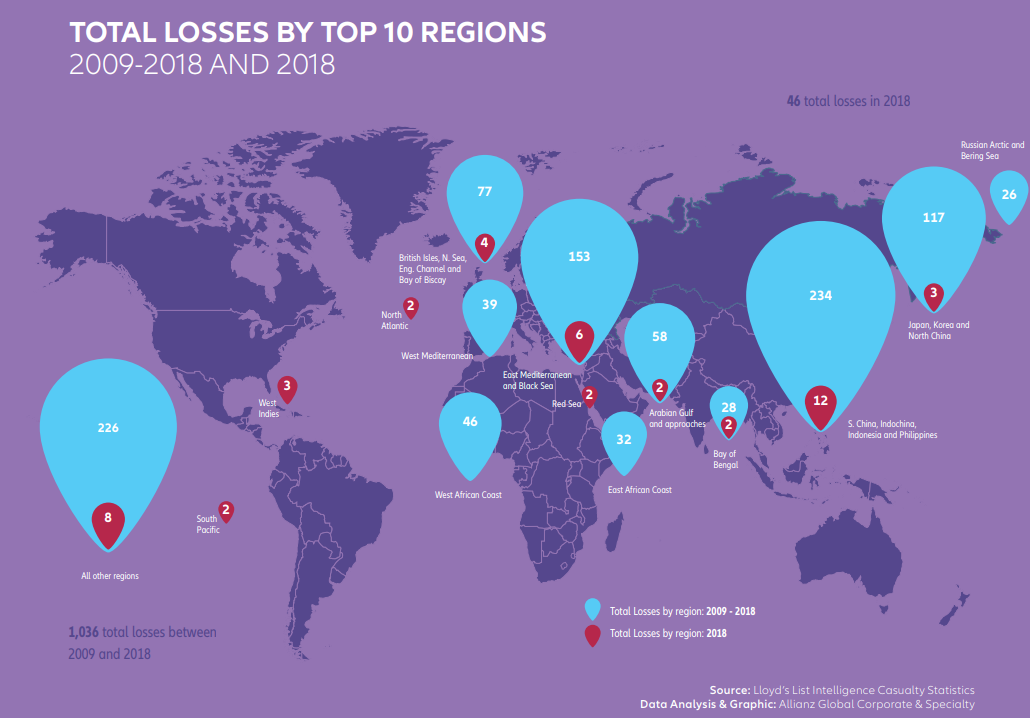
- South China, Indochina, Indonesia and Philippines (234 total losses) has been the top loss hotspot since the turn of the century, followed by the East Mediterranean and Black Sea (153) and Japan, Korea and North China (117).
- Together, the top 10 maritime regions account for three in four (78%) of all losses over the past 10 years. There have been 1,036 reported total losses of vessels over 100GT in the past decade.
Featured Post
 The hijacking of M.V. Abdullah
 The hijacking of M.V. Abdullah By Ghulam Suhrawardi* Since the first hijacking of Bangladeshi vessel M.V. Jahan Moni in December 2010, M.V. Abdullah was the second vessel to encounter the same fate on March 12, 2024. KSRM Group, the parent company of SR Shipping Limited, owns both vessels. Based on […]
 Candidates for Secretary-General of IMO
 Candidates for Secretary-General of IMO in International Shipping News 04/04/2023 Seven IMO Member States have each nominated a candidate for the post of Secretary-General of the International Maritime Organization (IMO). The term of the current incumbent, Mr. Kitack Lim of the Republic of Korea, expires on 31 December 2023. The nominations received […]

RECENT JOB OPENINGS

